


For decades, Bihar was widely grouped among the so-called “BIMARU” states, a term coined in the 1980s to describe states with weak development indicators. The label came to symbolise administrative drift, poor infrastructure, and an economy unable to keep pace with the rest of India. Bihar was often invoked as an example of persistent developmental failure.
However, the Household Consumption Expenditure Surveys of 2011-12 and 2023-24, spanning part of Nitish Kumar’s tenure in office, suggest that this narrative no longer adequately describes the state. Bihar appears to have made substantial gains in living standards, sharply reduced poverty, improved nutritional affordability, and narrowed some of its gaps with the national average. A comparison with neighbouring West Bengal highlights the scale of this change. West Bengal began the period with higher incomes, lower poverty, and a stronger urban economy, yet its progress on several indicators is significantly slower over the same period.
In nominal terms, both states show large increases in household consumption expenditure. Bihar’s rural monthly per capita consumption expenditure (MPCE) rose from Rs 1,086 to Rs 3,531, implying a compound annual growth rate (CAGR) of 10.3 per cent, higher than the all-India rural figure of 9.1 per cent. West Bengal’s rural nominal MPCE increased from Rs 1,211 to Rs 3,366, a CAGR of 8.9 per cent, below the national pace. Bihar’s urban nominal MPCE grew at 10.7 per cent, while West Bengal recorded only 6.9 per cent, compared with India’s urban growth of 8.4 per cent.
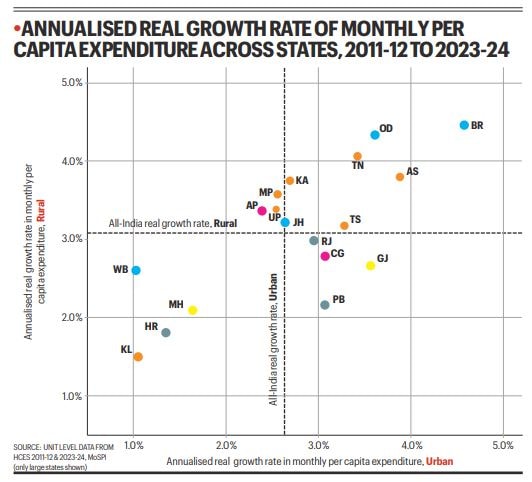
Nominal figures, however, can mislead when inflation differs across states. Once these values are adjusted using state-specific price indices, Bihar’s relative improvement becomes clearer. Bihar’s rural real MPCE grew at 4.5 per cent annually, about 50 per cent faster than the all-India rural pace of 3.1 per cent. Its urban real CAGR of 4.6 per cent also exceeded India’s 2.6 per cent. West Bengal’s growth was more modest: A rural real CAGR of 2.6 per cent and an urban real CAGR of 1.0 per cent. Expressed relative to the national average, the trend is even clearer. Bihar’s rural MPCE rose from 80.5 per cent of the all-India figure to 91.7 per cent. Its urban ratio increased from 58.7 per cent to 75.4 per cent. West Bengal moved in the opposite direction. Its rural ratio declined from 89.8 per cent to 87.5 per cent, and its urban ratio fell from 97.5 per cent to 82.8 per cent.
Aggregate convergence can sometimes conceal uneven gains if growth benefits only the better-off. To examine this possibility, we consider real MPCE growth across the bottom 20 per cent, the middle 40-60 per cent, and the top 20 per cent. Bihar’s gains appear broadly distributed. In rural areas, real MPCE for the bottom 20 per cent had a CAGR of 4.2 per cent. The middle quintile rose at 4.6 per cent, while the top 20 per cent increased at 4.4 per cent. The narrow range across quintiles suggests that gains were not concentrated among the better-off. In urban Bihar, the pattern is even more pro-poor. The bottom 20 per cent recorded growth of 5.7 per cent, the middle grew at 5.1 per cent, and the top 20 per cent at 3.6 per cent.
West Bengal presents a different picture. In rural areas, the bottom 20 per cent and middle quintile both grew at 3.1 per cent, while the top 20 per cent recorded 1.8 per cent. Urban trends are even weaker: The bottom 20 per cent grew at 3.2 per cent, the middle at 1.9 per cent, and the top 20 per cent recorded a negative CAGR of -0.4 per cent. On these estimates, real consumption of West Bengal’s urban elite has fallen below their 2011-12 level.
Convergence ratios reinforce this pattern. Bihar’s rural bottom 20 per cent, which stood at 97.7 per cent of the all-India figure in 2011-12, rose to 101.0 per cent by 2023–24. Its rural middle quintile improved from 87.9 per cent to 98.4 per cent, while its rural top 20 per cent rose from 67.1 per cent to 87.0 per cent. In West Bengal, the ratios deteriorated across groups. Its rural bottom 20 per cent, once above the national average at 102.8 per cent, declined to 93.2 per cent, while its urban top 20 per cent fell from parity with the national average to 81.9 per cent by 2023–24.
Estimates based on the Rangarajan poverty line, updated to 2023-24 using state-level consumer price indices, indicate a sharp reduction in poverty in Bihar. In 2011-12, Bihar’s poverty rate stood at 41.3 per cent. By 2023-24, it had fallen to 4.4 per cent — near parity with the all-India figure of 4.0 per cent. West Bengal began the period with a poverty rate 11 percentage points lower than Bihar’s (30.4 per cent), yet by 2023-24, its estimated poverty rate is higher (6.0 per cent).
Another important welfare measure is whether households can afford a nutritionally recommended diet. In 2011–12, Bihar was the weakest performer among major states: 64.7 per cent of households could not afford a recommended diet, compared with 56.0 per cent in West Bengal and 49.0 per cent nationally. By 2023-24, Bihar had reduced this share to 27.4 per cent. This improvement exceeds that recorded in West Bengal (from 56.0 per cent to 34.6 per cent) and the all-India improvement of 25.9 percentage points.
This evidence points to a substantial improvement in Bihar’s economic position between 2011-12 and 2023-24. West Bengal, by contrast, shows weaker performance.
These changes occurred during a long period of political stability and governance continuity under Nitish Kumar. Household survey data alone cannot establish a simple causal relationship; multiple factors may have contributed, including broader national changes, welfare expansion, migration, and inflation dynamics. Even so, the breadth and consistency of Bihar’s improvement align with the possibility of a significant transformation in living standards. At the very least, the consumption data suggest that Bihar’s long-standing image as a state of permanent economic failure is no longer tenable. That shift is an important part of Nitish Kumar’s legacy.
The writer is member, EAC-PM
